Introduction
Our company, SyriaTel, is a telecommunications company based and operating in Syria, and is looking to better understand the patterns shown by customers who are likely to switch to another telecom company, referred to as “customer churn.” While it will be impossible to predict with 100% confidence who will or won’t churn, not least of which due to a variety of confounding factors relating to more than 13 years of civil war and the recent collapse of the ruling regime, we can search for predictable patterns within customer data that would highlight potential warning signs that a SyriaTel customer may be on the verge of churning.
The essential questions for us to address are:
- What factors indicate that a customer may churn? Are there any predictable patterns?
- What can SyriaTel do to minimize the likelihood of churning?
These questions present us with a classification problem, as we are trying to understand a binary scenario: will the customer churn or not?
While some margin of error is expected, and we need to pay more attention to errors that would incorrectly predict a customer will not churn (when in reality they will churn), as this would preclude us from deploying strategies to maintain this customer, and losing a customer is far more costly to the company.
What we need to do, then, is run several predictive classification models and see which one performs best.
Data Understanding
To answer these questions, we will treat the problem as one of binary classification and construct a predictive model. In order to maximize analytical efficacy, we will utilize several different machine learning models for classification and determine which model is more useful by comparing scores assessing the models’ performance.
False Negatives and False Positives
- A positive prediction entails that the customer is likely to churn.
- A negative prediction indicates a customer is not likely to churn.
While we must be wary of both False Positives (FPs) and False Negatives (FNs) in our predictive models, since our purpose is to minimize customer churn we must prioritize minimizing rates of False Negatives, as falsely predicting a customer is unlikely to churn means that SyriaTel will fail to act to prevent this churn, whereas a False Positive will cost the company less in the long run as the customer will not churn.
Model Scoring
For this reason, we will prioritize comparing the following in evaluating the various models:
Recallscore, also known as “sensitivity”, which essentially evaluates how successful our models were in actually predicting Positives. In other words, a high Recall score means fewer False Negatives.ROC-AUC[Receiver Operator Characteristic – Area Under the Curve] score, which essentially provides a scaled value that determines how effective our models were in distinguishing between Positive and Negative outcomes.
Dataset: Features & Target
The dataset we will be working with, which can be found here, is pulled from Kaggle.
The dataset contains records for 3,333 customers, and 21 columns with a variety of information about the customer.
Our Target column will be churn, which contains boolean values of whether the customer churned or not. The dataset indicates that about 14% of customers did churn, while 86% did not churn.
This leaves 20 columns to be considered as Features. While the dataset includes a number of Categorial Variables (object datatypes), the majority of columns are Discrete Numeric (integer or float datatypes). Luckily, the dataset contains no null values.
To prepare our dataset, we carried out the following steps:
- Cleaning the data by removing unnecessary columns and converting others to integers.
- Splitting the data into different sets for training, validation, and testing.
- Addressing class imbalance in the Target variable using SMOTE (synthetic minority oversampling) that compensates for the imbalance by oversampling the minority class.
- Scaling the dataset using
StandardScaler.
Modeling
To start, we run three separate vanilla (untuned) models on the training data and compare the resulting Recall and ROC_AUC scores to determing which model performs best. For each model, we ran a five-fold cross validation to give the results more depth and to compare to training scores.
The three models we run are:
- Logistic Regression
- Random Forest Classifier
- Adaptive Boost Classifier
After running untuned models for these three, we then tried to tune hyperparameters for the Random Forest Classifier using GridSearchCV, and found a Recall score of 76% and an ROC_AUC score of 94%.
We designate the hyper tuned Random Forest Classifier as our final_model and deploy it on our testing data, and found a 79% Recall score, meaning this model will correctly predict Positive cases about 4 out of 5 times. Put differently, this model will only fail to identify a True Positive (that is, mis-predict a False Negative) once out of every 5 times.
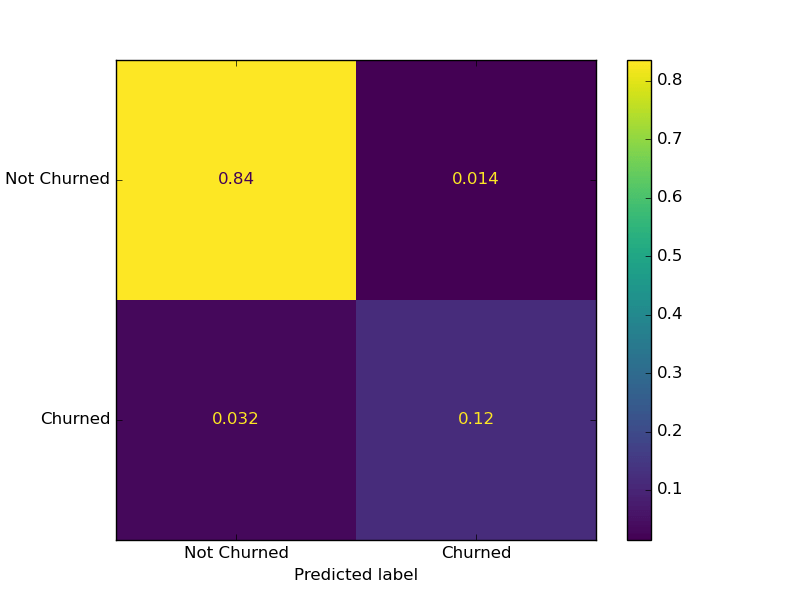
Checking Results on Confusion Matrix
To put it more starkly, we will check how our model performs using a Confusion Matrix, which graphs in a simple way all the True and False Positives, as well as all True and False Negatives.
Feature Significance
With our final_model set, we can use it to identify which Features are most influential in determing whether a customer churns or not with .feature_importances_.
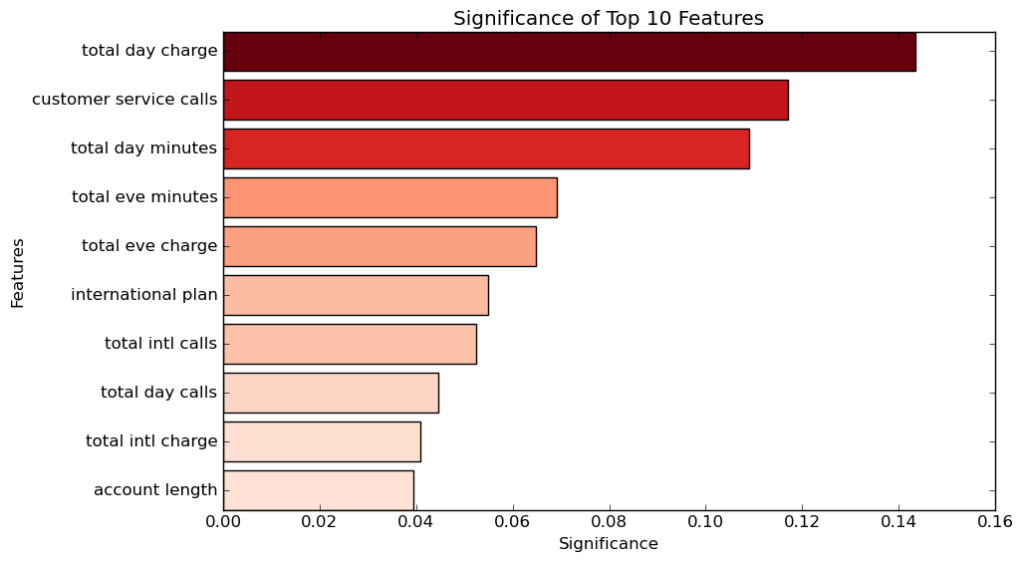
As we can see from the graph, we have the Top 10 Features in terms of their significance on predicting whether or not a customer will churn. Of these features, the Top 3 stand above the rest in their significance:
total day charge, or the total charge for calls made during the day.- The biggest factor is how much customers were charged for calls they made during the day. The reason day calls are more significant than night calls is most likely due to the fact people make most of their calls during the day.
- The more they were charged, the more likely they are to churn.
customer service calls, or the number of times the customer has called customer service.- The second biggest factor in customer churning is the number of times they have reached out to custoemr service. This could be due to the fact that customer service was unable to help them fix their problems, or that customer service is not an easy or reliable experience for customers.
- The more a customer calls customer service, the more likely they are to churn.
total day minutes, or the total minutes spent on calls during the day.- This is closely related to total day charge, as more minutes spent during calls means a higher charge.
- Customers are more likely to churn if they have higher day minutes.
Conclusion
False Negatives and Recall
In analyzing patterns that lead to customers churning, we paid special attention to the rates of identifying False Negatives, or incorrectly predicting a customer will not churn. For our purposes, False Negatives would be far more costly than False Positives: if we mistakenly identify a customer as one who will churn and deploy strategies to keep the customer, it is true that it technically would have been a waste of resources, however even in this case it would only serve to strengthen their loyalty to the company.
On the other hand, if we failed to identify a customer who is on the verge of churning, then we will fail to deploy the strategy to maintain the customer and will lead to the customer churning, a much higher cost to the company than unwisely spending resources on customers who wouldn’t have churned.
To minimize our rates of False Negatives, we focused on maximizing the Recall Score of our models, which directly reflects the models’ abilities to identify False Negatives.
Testing and Tuning Models
Out of the three vanilla models we started off with, the Random Forest Classifier performed best in terms of our Recall and ROC_AUC. We then tuned the parameters of this model until we found the optimal configuartion in maximizing the Recall.
This Classifier essentially runs several Decision Trees and uses insight from them to form a final prediction. It’s adept at handling non-linear relationships, and for our purposes, is well-suited in determining the significance of the Features in making these predictions. Though susceptible to bias due to imbalanced datasets, we were able to minimize this using SMOTE to oversample our minority Target class.
Feature Significance
Our model helped us identify the top factors that determine customer churn:
- Day Calls: how much time a customer spent making calls during the day and, relatedly, how much they were charged for these calls.
- Customer Service Calls: how many times a customer called SyriaTel’s customer service number, indicating either that customer service was unable to resolve the customer’s issues, or that the experience of contacting customer service was itself unpleasant.
Limitations
There were a number of factors that hindered our ability to engage with the data and bring forth appropriate insights, including:
- Lack of knowledge around the timing of these customers churning and if they coincided with policy changes at SyriaTel, such as price hikes or alterations to plans.
- Difficult to account for policy changes at competing telecom companies, so we’re unable to determine if customers churned due to preferable plans at competitors.
Recommendations
With the insights we have gained, we recommend the following:
- Revisiting our Customer Service protocol, and potentially revamping the entire process so it is more pleasant to the customer and more responsive to their needs.
- Reconsidering charges and plans for day calls, potentially providing a voucher of sorts for customers who call customer service and have high rates of day calls.
Next Steps
Our next steps would include further investigation into custoemr churn, specifically addressing the limitations outlined above.
Specifically: Finding out the timing of these customer churns, to determine potential overlap with SyriaTel policy changes or policy changes at competitors.
